Getting alerted when cycle paths flood: part two
I recently moved back to York, a city I absolutely love. One of the best things about living here is cycling. But York has two rivers, one of which brings rain from hills a long way away. Some of the best cycle routes can flood after rainfall when the rivers rise.
This post is aimed is at software engineers with DevOps skills who already run Prometheus and Grafana. If you don’t have those skills then I’d be interested in figuring out how to make this more widely available–contact me.
In the first post I explained how to get River Water Level data exposed in a way that Prometheus can scrape. In this post we’ll get Prometheus scraping the data, and then look at how we can get alerts and see the data in Grafana.
Scraping river water levels into Prometheus
I have deployed the flood-exporter we built in my last post, and it’s running at flood-exporter.46bit.cloud. You can also run it yourself using the example manifests in github.com/46bit/flood-exporter.
Scraping this endpoint into Prometheus is simple (since I’m very familiar with Prometheus.) Here’s the YAML config:
scrape_configs:
- job_name: river_level_metrics
  scheme: https
  static_configs:
  - targets:
    - flood-exporter.46bit.cloud
  metrics_path: /probe
  scrape_interval: 180s
  params:
    target:
      - https://environment.data.gov.uk/flood-monitoring/id/stations/L2406.json
https://environment.data.gov.uk/flood-monitoring/id/stations/L2406.json is specific to York. See the previous post to understand how to get river data for a different place.
This should “just work” :)
There are three metrics available:
river_level_measurement, storing the current river level in metresriver_level_min_on_record, storing the lowest river level that’s been measuredriver_level_miaxon_record, storing the highest river level that’s been measured
In York the river level is updated every 15 minutes, so the Prometheus config only bothers to scrape every few minutes. I don’t know if it’s different elsewhere.
Building a dashboard in Grafana
Now that the data’s in Prometheus, we’re free to use it in a Grafana dashboard.
Some of the Grafana dashboard is going to be specific to York, but I’ll give you my config and you can tune it to your needs.
The river levels used for these alerts are from nosearmy.com/isitflooded/. All credit to them.
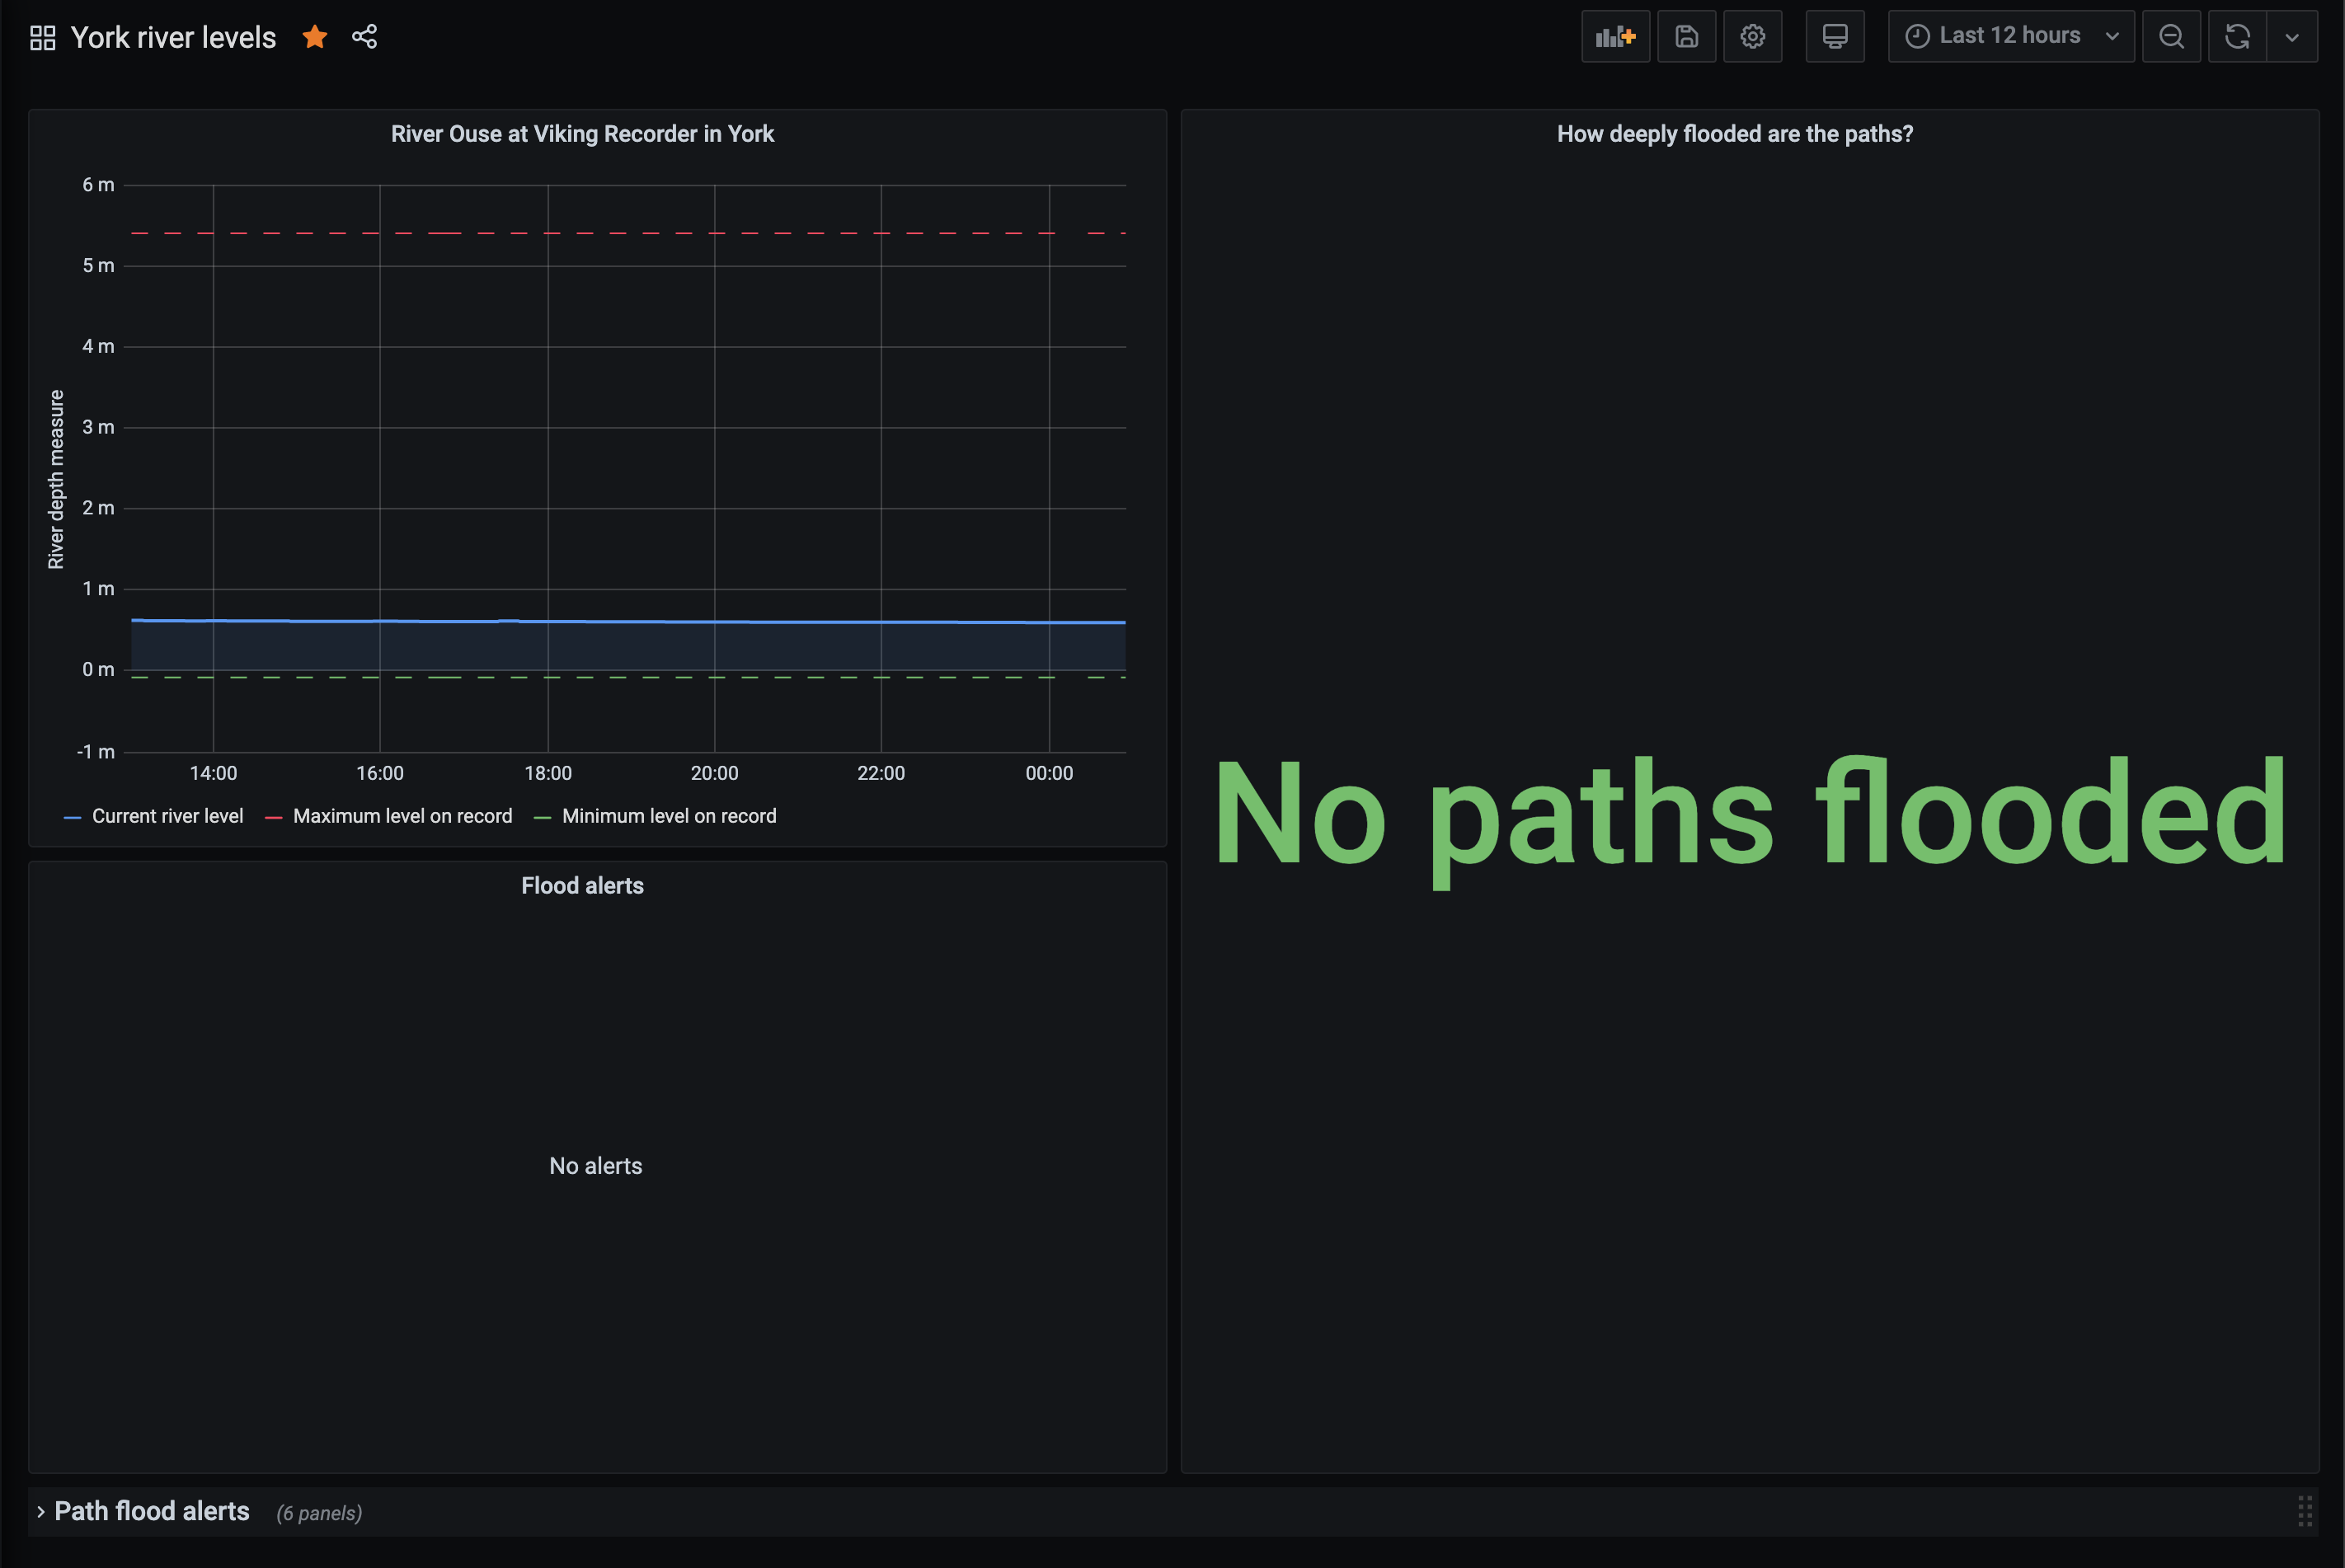
Here’s what my dashboard looks like when things are OK:
Here’s what my dashboard looks like when there’s a flood (only simulated as there hasn’t been one since I deployed this):
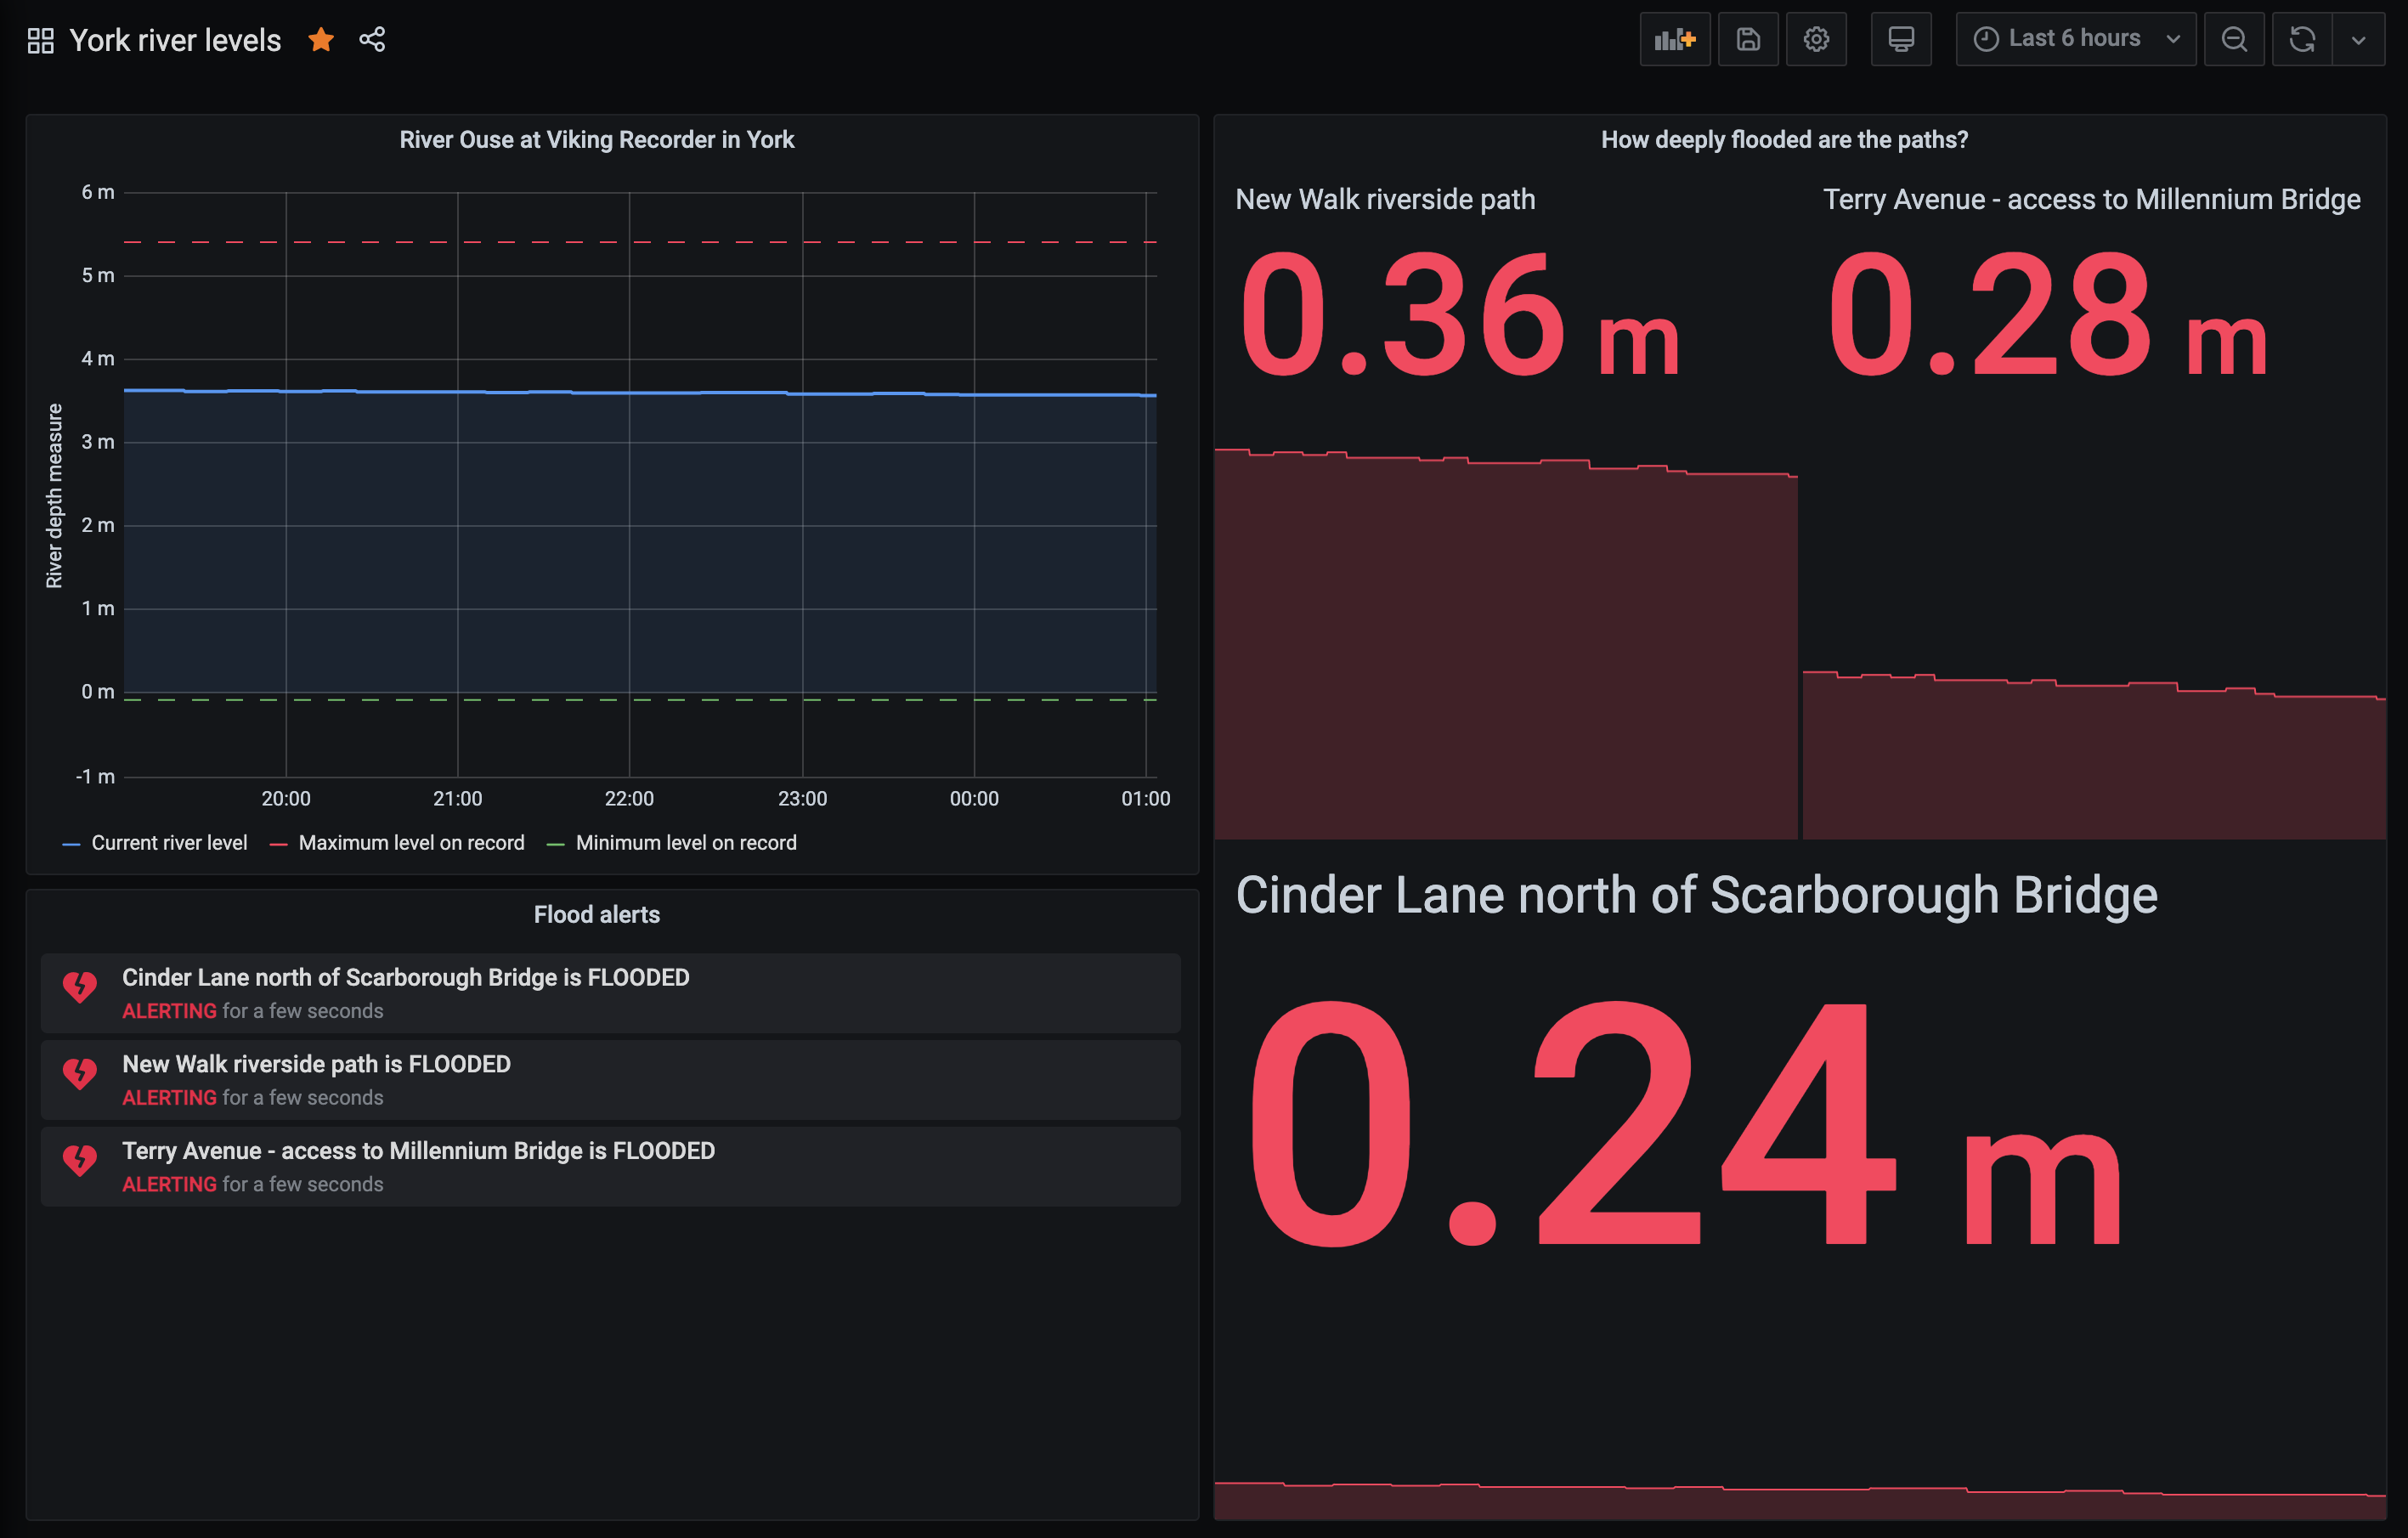
The really cool thing about this is that the right-hand side panel tells me how deeply paths are flooded. On a bicycle I can go through a few centimetres, but not 20 or 30cm.
You can get the source code for my Grafana dashboard at gist.github.com/46bit/a05a6d5bd1f2dc9a4bdfa0c87d328452. Install it into your Grafana and it should just work, provided you’ve got Prometheus scraping the data.
Setting up alerts
I’m using Grafana Cloud to run my Grafana, so it’s easier to use Grafana Alerts than to configure Alertmanager.
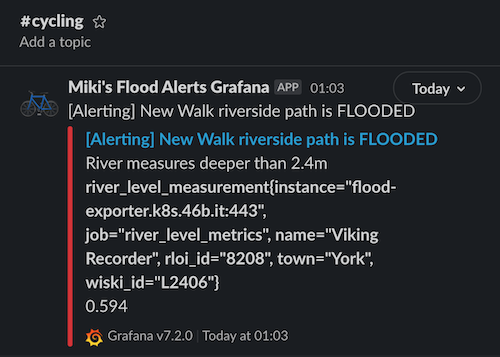
The Grafana dashboard above includes a bunch of alerts for each of the different paths. I’ve got them forwarding messages to a #cycling channel in York-specific Slack group that I’m in:
Rather than trying to teach you how to use Grafana Alerts, install my dashboard and tweak it for your purposes. Expand the Path flood alerts row at the bottom of the dashboard and you can edit the alerts in there.